

肠道碱性磷酸酶解毒脂多糖并预防炎症在肠道微生物群的响应
来源:
|
作者:詹妮弗·M·贝茨1,Janie Akerlund,Erika Mittge,和Karen Guillemin
|
发布时间: 2020-06-23
|
15217 次浏览
|
🔊 点击朗读正文
❚❚
▶
|
分享到:
脊椎动物的肠道菌群中含有丰富的脂多糖(LPS)或内毒素。我们证明,刷状缘酶-肠碱性磷酸酶(Iap)在斑马鱼肠道菌群形成过程中被诱导从而在促进黏膜对肠道细菌的耐受中起着关键作用。我们证明,iap缺乏的动物对lps的毒性反应是通过Myd88和肿瘤坏死因子受体(Tnfr)介导的机制来感应的。我们进一步证明,内源性微生物群通过一个涉及myd88和tnfr的过程建立了肠道中性粒细胞的正常稳态水平。iap缺乏的动物表现出过多的肠道中性粒细胞流入,类似暴露于lps的野生型动物。但在无细菌饲养的情况下,缺乏Iap的动物的肠道内缺乏中性粒细胞,这表明iap具有防止肠道细菌炎症反应的功能。
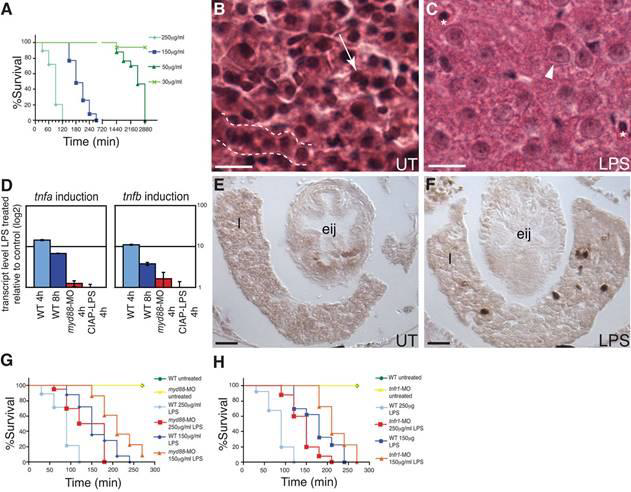
Figure 2.
LPS toxicity in zebrafish. (A) Dose-dependent killing of wild-type animals exposed to LPS at
6 dpf. Analysis of survival curves show they are significantly different (Logrank test,P<0.0001). (B–C) H&E stained liver sections of untreated (UT) 8 dpf larvae or exposed to 100μg/ml LPS for 24h. (B) Hepatocytes in B show typical organization in cords (dashed line) with distinct nuclei (arrow). (C) LPS treatment resulted in disorganized tissue morphology, with cell boundaries that are difficult to distinguish and swollen hepatocyte nuclei (arrowhead), in contrast to the normal-sized nuclei of red blood cells (asterisks). Scale bar in panel B,C = 5 μm. (D) tnfa and tnfb transcript levels, assayed by qRTPCR, in WT and myd88-MO injected 7 dpf larvae exposed to 50 μg/ml LPS for 4 or 8 h, or WT exposed to 50 μ/ml CIAP treated LPS for 4 h. Data are representative of two repeated trials, in which all samples were run in triplicate. Error bars indicate standard deviation. (E–F) Mpo stained transverse sections of UT 8 dpf larvae or larvae exposed to 150 μg/ml LPS for 2h at the esophageal-intestinal junction (eij). Mpo-positive cells (dark brown) are present in the liver (1) of the LPS exposed animal in F. Scale bar in panel E,F = 10 μm. (G–H) Survival curves of myd88-MO or tnfr1-MO injected 7 dpf larvae exposed to 150 or 250 μg/ml LPS. Survival curves are significantly different (Logrank test, P<0.0001). n = at least 30 total animals for each sample treatment in at least 2 independent trials. All animals were exposed to LPS at 7 dpf except those in panel A, which all began treatment at 6 dpf to allow for 48 h time period to observe toxic effects of low doses of LPS (30–50 μg/ml) prior to termination of all experiments at 8 dpf.
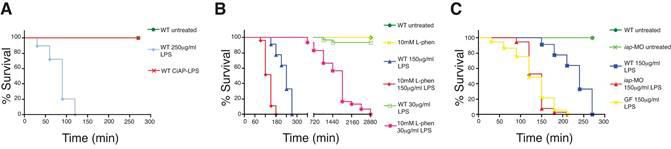
Figure 3.
Iap functions to detoxify LPS. (A) LPS pretreated with CIAP was non-toxic to zebrafish at 250 μg/ml LPS, in contrast to mock treated LPS. Inhibition of IAP activity using (B) L-phen, or (C) with iap-MO or by rearing larvae GF, significantly increased susceptibility of larvae to
LPS killing. Survival curves are significantly different (except WT untreated and WT CIAPLPS in A, WT untreated, 10mM L-phen and WT 30 μg/ml LPS in B, and iap-MO 150 μg/ml
LPS and GF 150 μg/ml LPS in C, Logrank test, P < 0.0001). All animals were administered LPS at 7 dpf except in panel B, where animals exposed to 30 μg/ml LPS began treatment at 6 dpf. All animals were reared CV, unless otherwise indicated. n = at least 30 total animals for each sample group, in at least two independent trials.
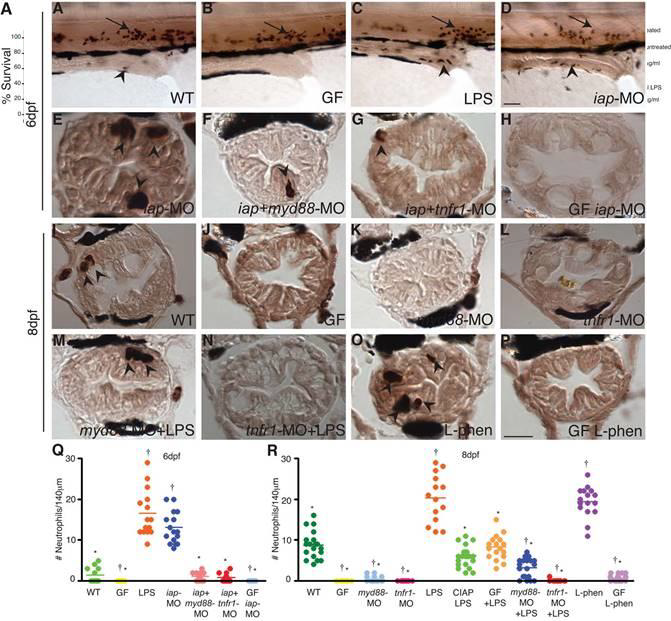
Figure 4.
Iap functions to prevent intestinal neutrophil infiltration in response to the microbiota. Whole mount larvae at 6 dpf (A–D) and transverse sections through distal zebrafish intestines at 6 dpf (E–H) and 8 dpf (I–P) with Mpo positive neutrophils visualized in dark brown in the intestinal epithelium (arrowheads) and posterior cardinal vein (arrows); (black cells surrounding the intestinal epithelium are pigment cells.) The WT intestine contained low numbers of neutrophils at 6 (A) and 8 dpf (I), whereas GF intestines were devoid of all neutrophils (B,J). Neutrophil numbers increased significantly upon exposure to 150 μg/ml LPS for 2h (C) or with inhibition of endogenous Iap with iap-MO (D,E) or L-phen (O). Neutrophil infiltration was inhibited in myd88-MO (K) or tnfr1-MO injected larvae (L), even upon exposure to 150 μg/ ml LPS for 2h (M–N) or co-injection with iap-MO (F–G). In the absence of microbiota, Iap inhibition did not induce neutrophil influx (H,P). All animals were reared CV unless otherwise indicated. Scale bar in panel D (A–D) = 50 μm, scale bar in panel P (E–P) = 5 μm. (Q–R) Quantification of neutrophils per 140 μm of distal intestine, n = at least 13 animals per treatment; bar indicates average value for each group. † indicates values that differ significantly from WT, * indicates values differ significantly from WT LPS treated, P < 0.01. One-way analysis of variance (ANOVA) show treatments differ significantly, (Q) F = 99.24, P < 0.0001 (R) F = 142.7, P < 0.0001.
下一篇:
无
